Kaseya® VSA™
Network Performance Monitoring
Get Visibility into Network Performance Problems
Monitor Windows, VMware, Linux, Cisco IOS and 20 other operating systems covering a wide range of networking devices, web, database and email servers, log files and Windows performance counters.
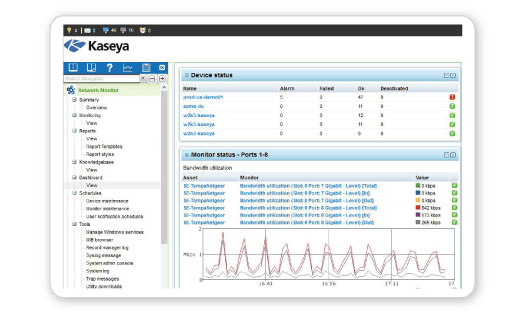
Kaseya Network Monitor is an agentless monitoring platform integrated directly into the Kaseya VSA which can be used to monitor all aspects of network connected devices including servers, hypervisors, routers, switches and firewalls.
Performance monitoring includes hypervisor, VM datastores, and host/device CPU, disk, memory and network bandwidth utilization as well as switch/router/firewall monitoring. On Windows platforms, both Windows performance registry counters and WMI queries are available.
File and directory monitoring can monitor if a file exists, the number of files in a directory, directory size and capacity, and if new files are added on a schedule.
Log monitoring triggers notifications and other actions when a log message is encountered that matches a pre-defined filter. Windows event log, Linux/Unix syslog and text log files are supported.
Database monitoring includes support for monitoring Oracle, MySQL, Microsoft SQL Server and a generic ODBC monitor for use with other DBMS. All of the monitors can perform a SQL query as well as additional performance monitoring specific to each DBMS.
The SNMP trap monitor has advanced filtering capabilities and alarm conditions can be setup to respond to specific properties of the received trap. Additionally, an SNMP query monitor can poll specified OIDs, perform a simple calculation, and compare the result with a specified value.
The Mail Quality of Service monitor makes it possible to test the ability of a mail server to send and receive mail. Statistics about round trip time, time to send and login time are stored.
Lua Script – “There’s a script for that!”
Lua is a lightweight and easy to learn script language that is embedded into Kaseya Network Monitor. Using Lua and the Kaseya Network Monitor application programming interface, create your own monitoring and recovery functions. To make development efficient, Kaseya provides a free Integrated Development Environment (IDE). Scripts can easily be exchanged between users on the Kaseya forums.
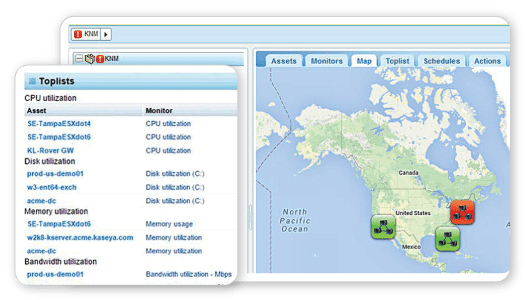
Toplist
The toplist function delivers key metrics on all monitored resources in your network. The toplists can answer questions such as:
- What machines are using most CPU on average this month and how does it compare to last month?
- What machines have the least available disc capacity and how fast are the amounts of free disc space declining?
- What machines in the network transfer most data over the network during a day, week or month?
The numbers are processed and updated in real-time as the monitors test and can provide invaluable insights into your network.
Reporting
- Reporting elements include charts, data tables, toplists and more.
- Reports can be scheduled to be generated and delivered by e-mail to specific operators or automatically published in local or remote folders via file transfer
- Kaseya Network Monitoring includes a set of pre-configured reports.
Dashboards
- Network maps with status and bandwidth usage visualization.
- Includes a selection of useful widgets ranging from real-time information to notepads.
- Dashboards can be viewed without the need to log into the system.

Vulnerability Protection
Visibility to Vulnerabilities (CVEs) by aggregating the patch status of the network in one dashboard

Rapid Distribution on and off Network
Rapid Distribution leverages the Agent Endpoint Fabric to optimize the delivery of installer packages, even over latent networks. Eliminates the need for a centralized File Share or LAN Cache.

Scan & Analysis functionality
Schedule a Scan & Analysis of the network on a regular routine so you can automate updates

Scheduling
Blackout Windows enable you to halt processing during a defined period of time

Policy profiles for automation of approval, review or reject
Policy Profiles – Simplify updates using standardized, scalable profiles to approve, deny, or provide machine associations

Ability to override profiles
Ability to Override Profiles allows you to deny a specific patch, KB, or block a specific update to a subset of machines

Migration from VSA Patch Management Module
Migration from VSA Patch Management** is supported for customers with an existing VSA who want to evolve their software management service
*Visbility to 3rd Party Patching status is included with core Software Management functionality. However, installation of 3rd Party applications is licensed separately.
** VSA Patch Management remains available though Kaseya recommends new customers configure solely through Software Management